Quick answer:
The ROI of a post-purchase experience is calculated across four distinct revenue levers, each with its own formula. For a mid-sized e-commerce brand spending $500K per year on shipping with 10,000 monthly orders, the combined ROI across all four levers typically reaches $80,000-$200,000 per year. LateShipment.com’s post-purchase ROI calculator lets you plug in your own numbers and generate a business case in under 5 minutes.
Key Takeaways
- For CEOs and growth leads: Post-purchase is not a cost center: it’s a revenue layer that most brands haven’t measured. The four formulas in this guide quantify the impact of tracking, returns, refunds, and shipping insurance in terms finance teams recognize: cost savings, revenue uplift, and recovered cash.
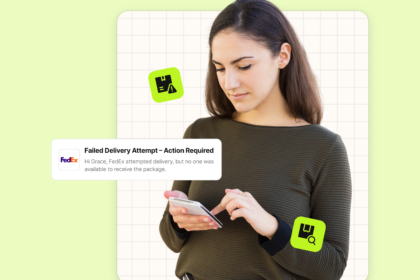
- The WISMO cost is larger than most CEOs realize: WISMO (Where Is My Order) queries account for 70% of post-purchase support volume. At $4-$7 per contact, a brand handling 3,000 WISMO tickets per month is spending $144,000-$252,000 per year on a problem that proactive tracking notifications largely eliminate.
- The tracking page is a revenue channel: Your tracking page is visited an average of 4+ times per order. For a brand with 10,000 monthly orders, that’s 40,000+ monthly sessions on a page that most brands leave blank or hand to a carrier. A branded tracking page with product recommendations converts that traffic into repeat purchase revenue.
- Refund recovery is cash, not projection: Shipping refund recovery through automated parcel auditing is not a projected revenue uplift: it’s cash recovered from overcharges and service failures that the carrier owes you and that expires if not claimed within 15 days. For a business spending $500K per year on shipping, 6-20% recovery is $30,000-$100,000 in recovered cash per year.
Post-purchase is the most underutilized revenue channel in e-commerce. The moment after checkout: the shipping notifications, the tracking page, the delivery experience, the returns flow: generates more customer touchpoints than the acquisition funnel. Customers visit the tracking page an average of four times per order. They open shipping notification emails at 3x the rate of marketing emails. And yet, most brands have no financial model that connects those touchpoints to revenue.
The reason is simple: post-purchase has historically been managed as an ops cost. Shipping spend goes to logistics. Support ticket volume goes to the CX team’s headcount budget. Returns cost goes to a write-off line. None of it gets measured as a revenue function.
This guide changes that framing. It gives you the formulas to calculate the revenue impact of your shipping experience across four measurable levers, the benchmarks to set realistic ROI targets, and the metrics your finance team needs to approve a post-purchase investment.
What is Post-Purchase ROI?
Post-purchase ROI is the financial return generated by investments in the shipping experience, order tracking, returns management, and carrier cost optimization relative to the cost of those investments. It is measured across four distinct revenue streams, each of which has a different calculation method and a different time-to-value profile.
The reason most e-commerce brands have not calculated their post-purchase ROI is that the return sits in three different budget lines (support cost, revenue, and shipping spend) and is attributed to three different teams (CX, growth, and operations). The calculation requires pulling those three lines together under a single framework.
The framework in this guide does that. It treats post-purchase as a single revenue function with four measurable outputs and maps each output to the platform capability that drives it.
The 4 Post-Purchase Revenue Levers and How to Calculate Each One
Here are the four formulas. Each includes the inputs you need, the calculation logic, a worked example using a mid-size e-commerce brand, and the industry benchmarks to use if you don’t yet have your own data.
1. WISMO Support Cost Reduction
WISMO (Where Is My Order) queries account for approximately 70% of post-purchase support volume. At $4-$7 per ticket (industry average across email and phone channels), a high-WISMO brand is spending a meaningful portion of its support budget on a problem that is largely preventable through proactive communication.
The ROI mechanism is straightforward: when customers receive proactive shipping notifications and can look up their order status without contacting support, WISMO contact volume drops. LateShipment.com merchants report up to 72% reduction in WISMO contacts after enabling proactive notifications and self-serve order lookup via OneTrack.
WISMO reduction ROI formula
Annual WISMO savings = (Monthly WISMO contacts x Cost per ticket x 12) x Reduction rate
Example: Brand with 3,000 WISMO contacts/month at $5/ticket, 60% reduction rate: (3,000 x $5 x 12) x 0.60 = $108,000 per year in avoided support cost
2. Branded Tracking Page Repeat Purchase Revenue
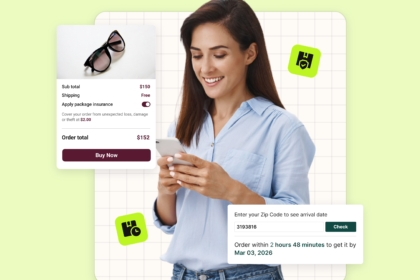
The tracking page is the most visited post-purchase destination: customers check it an average of 4+ times per order. For a brand with 10,000 monthly orders, that is 40,000+ monthly sessions on a page with high purchase intent and zero marketing cost.
Most brands send those sessions to the carrier’s generic tracking page, which has no brand identity, no product recommendations, and no conversion mechanism. A branded tracking page on your own domain with embedded product recommendations converts a fraction of that existing traffic into repeat purchases: without any additional acquisition spend.
The conversion rate uplift from a well-configured branded tracking page with product recommendations typically runs 1-3% of tracking page sessions. At the lower end, this is still material at scale.
Inputs you need:
- Monthly WISMO contact volume: pull from your helpdesk (Gorgias, Zendesk). Filter for post-purchase shipping status queries.
- Cost per ticket: divide your monthly support team cost (fully loaded: salary + benefits + tools) by total monthly ticket volume.
- Reduction rate: use 50-72% as a benchmark range if you don’t have before/after data. Conservative models use 40%.
Branded tracking page revenue formula
Annual revenue = (Monthly tracking visits x Incremental CVR) x AOV x 12
Example: 10,000 orders/month, 4 visits/order = 40,000 visits. 1.5% CVR uplift x $75 AOV x 12 months = $540,000 additional annual revenue
Inputs you need:
- Monthly tracking page visits: tracking page visits = monthly orders x average visits per order (use 4 as a conservative benchmark).
- Incremental conversion rate: 1-2% is a conservative estimate for brands new to tracking page optimization. 2-3% for brands with strong product recommendation placement and existing repeat purchase affinity.
- Average order value: pull from your e-commerce platform analytics.
3. Returns-to-Exchange Revenue Retention
40% of returns could become exchanges if the exchange process were made easier than getting a refund. Customers who exchange spend 25% more than their original purchase. Store credit holders spend 15% more per transaction than cash refund customers.
The revenue retention ROI is the difference between what you recover from a customer who gets a cash refund (zero, if they don’t repurchase) versus what you recover from a customer who exchanges (the retained sale plus the 25% incremental spend). For brands with high return volumes, this is one of the largest untapped revenue levers available without any additional acquisition spend.
Returns revenue retention formula
Annual retained revenue = (Monthly returns x Exchange conversion rate x Incremental spend) x 12
Example: 500 monthly returns, 35% exchange rate, $20 incremental spend: (500 x 0.35 x $20) x 12 = $42,000 retained annually
Inputs you need:
- Monthly return volume
- Exchange conversion rate: use 30-40% as a benchmark for brands with exchange-first workflows. Brands with refund-first flows typically see 10-15% exchange rates, which represents the gap your investment closes.
- Incremental spend per exchange: customers who exchange spend 25% more than the original purchase. Use (AOV x 0.25) as the incremental spend figure.
4. Shipping Refund Recovery
Shipping refund recovery is the most concrete ROI calculation in this guide because it is not a projection: it is cash the carrier owes you that expires if not claimed. Carriers bill incorrectly on a predictable basis: late delivery on guaranteed services, duplicate charges, incorrect zone billing, surcharges applied at list rate instead of your contracted rate, and dimensional weight errors are all regular billing events that generate refund-eligible invoice lines.
The 15-day claim window for FedEx and UPS service failures means that manual review processes miss most of these claims. Automated parcel audit software (OneAudit) files claims within hours of invoice receipt. The typical recovery is 6-20% of annual shipping spend, depending on carrier mix, service level profile, and how many billing error categories are audited.
Shipping refund recovery formula
Annual recovered cash = Annual shipping spend x Recovery rate
Example: Brand spending $500,000/year on shipping at 12% recovery rate = $60,000 recovered annually, deposited directly into carrier account
Inputs you need:
- Annual shipping spend: pull from your carrier invoices
- Recovery rate: use 6% as the conservative floor (late delivery claims on guaranteed services only). 12-15% is typical for a full 50+ category audit. 20% applies to brands with complex carrier contracts and high accessorial surcharge exposure.
Conclusion
Post-purchase is not a cost to be minimized. It’s a revenue layer to be measured, modeled, and invested in.
The four levers in this guide. WISMO reduction, branded tracking page revenue, returns-to-exchange conversion, and shipping refund recovery: are all independently calculable from data you already have. Combined, they typically represent $80,000-$200,000 in annual impact for mid-size e-commerce brands and significantly more at higher shipping volumes.
The LateShipment.com suite (OneTrack, OneReturn, OneAudit, OneProtect) is built to deliver measurable returns across all four levers on a single platform, with per-shipment pricing and commission-only models that make the ROI calculation straightforward: you recover cash before you pay for the platform i.e., the platform pays for itself.
FAQs: Post-Purchase ROI
What are the key post-purchase metrics to track?
The ten metrics that matter most for post-purchase ROI measurement are: WISMO rate (percentage of orders generating a support contact), cost per WISMO ticket, tracking page visits per order, tracking page incremental conversion rate, return rate (overall and by SKU), exchange rate as a percentage of total returns, return processing cost per item, shipping refund recovery rate, on-time delivery rate by carrier, and DSAT (delivery satisfaction) score on exception-affected orders. These ten metrics give leadership teams a complete picture of where post-purchase investment is generating return and where the gaps are.
What is a post-purchase ROI calculator?
A post-purchase ROI calculator is a tool that quantifies the financial impact of your shipping and post-purchase experience across multiple revenue streams. A good calculator covers at minimum: WISMO support cost reduction, tracking page revenue uplift, returns-to-exchange conversion value, and shipping refund recovery. LateShipment.com’s post-purchase ROI calculator allows e-commerce brands to input their own shipping volume, return rate, support cost, and AOV figures to generate a personalized ROI estimate across all four levers.
What is a good ROI for post-purchase tool investment?
For mid-size e-commerce brands (5,000-25,000 monthly orders, $200K-$1M annual shipping spend), a reasonable full-suite post-purchase ROI is $80,000-$300,000 per year across all four levers. The payback period for LateShipment.com’s full suite (OneTrack, OneReturn, OneAudit, OneProtect) is typically under 60 days when refund recovery and WISMO savings are measured from the first two billing cycles. For larger brands (above $1M annual shipping spend), the refund recovery lever alone typically exceeds the full platform cost within the first billing period.